DMI - Radar reflectivity over Denmark#
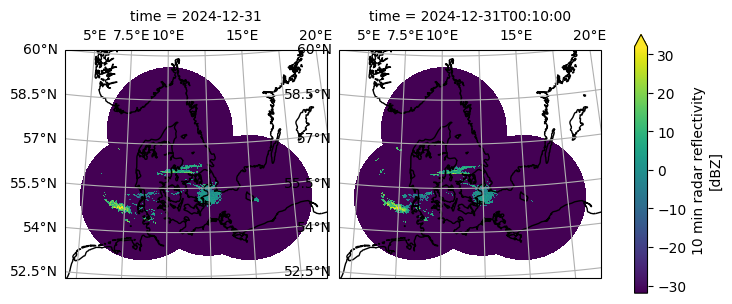
This notebook describes how to access and use the zarr-version of the DMI radar composite dataset. The dataset includes ten-minute reflectivity over Denmark, which is obtained by the five radars owned by the Danish Meteorologiske Institute (DMI). The v0.1.1 zarr version of thre dataset covers 2016 to the end of 2024.
The conversion of the radar composite was done by the code hosted on mlcast-community/mlcast-dataset-DMI
import matplotlib.pyplot as plt
import cartopy.crs as ccrs

import mlcast_datasets
cat = mlcast_datasets.open_catalog()
list(cat.precipitation)
['radklim_hourly',
 'radklim_5_minutes',
 'dmi_10_minutes',
 'it_dpc_sri_5min',
 'uk_metoffice_5min',
 'be_rmi_radclim_mfb_5min']
DMI 10-min reflectivity#
Mlcast catalog contains multiple datasets, hence to call specifically for DMI radar data:
ds = cat.precipitation.dmi_10_minutes.to_dask()
ds
<xarray.Dataset> Size: 14TB
Dimensions:  (time: 517536, y: 1728, x: 1984)
Coordinates:
  * time     (time) datetime64[ns] 4MB 2016-02-29 ... 2025-12-31T23:50:00
  * y        (y) float64 14kB -3.941e+05 -3.936e+05 ... 4.689e+05 4.694e+05
  * x        (x) float64 16kB -4.221e+05 -4.216e+05 ... 5.689e+05 5.694e+05
    lat      (y, x) float64 27MB dask.array<chunksize=(1728, 1984), meta=np.ndarray>
    lon      (y, x) float64 27MB dask.array<chunksize=(1728, 1984), meta=np.ndarray>
Data variables:
    crs      float64 8B ...
    dbz      (time, y, x) float64 14TB dask.array<chunksize=(1, 1728, 1984), meta=np.ndarray>
Attributes:
    Author:                     Thomas Bøvith (tbh@dmi.dk)
    Conventions:                CF-1.6
    consistent_timestep_start:  2016-02-29T00:00:00.000000000
    institution:                Danmarks Meteorologiske Institute (DMI)
    license:                    CC-BY-4.0
    mlcast_created_by:          Ricardo Jara <arjj@dmi.dk>
    mlcast_created_on:          2026-02-24T09:00:17.521323
    mlcast_created_with:        https://github.com/mlcast-community/mlcast-da...
    mlcast_dataset_identifier:  DK-DMI-precipitation
    mlcast_dataset_version:     0.1.1
title: radar-based precipitationvar_name = "dbz"
crs_name = ds[var_name].grid_mapping
data_crs = ccrs.Projection(ds[crs_name].crs_wkt)
g = (
    ds[var_name]
    .sel(time="2024-12-31")
    .isel(time=slice(None, 2))
    .plot(
        transform=data_crs,
        cmap="viridis",
        add_colorbar=True,
        col="time",
        robust=True,
        subplot_kws=dict(projection=data_crs),
    )
)

for ax in g.axes.flat:
    ax.coastlines()
    ax.gridlines(draw_labels=["top", "left"])
/tmp/ipykernel_2515/1860960605.py:15: FutureWarning: self.axes is deprecated since 2022.11 in order to align with matplotlibs plt.subplots, use self.axs instead.
  for ax in g.axes.flat: